Kubernetes Centralized Logging: Best-in-Class Observability Pipeline for 100+ Microservices
Six months ago, I implemented a centralized logging pipeline for Kubernetes-based microservices running in production.
The goal was simple: build a reliable, scalable, secure, searchable, and alertable observability pipeline that could handle logs from more than 100 microservices without becoming fragile, expensive, or difficult to operate.
The result was a production-ready logging architecture where every microservice writes structured logs to stdout and stderr, and the platform takes care of collection, buffering, processing, storage, search, dashboards, alerting, and long-term retention.
The pipeline has been running successfully for six months with no major issues.
The Problem
When a system grows beyond a few services, logging becomes much more than “write logs somewhere.”
In a Kubernetes environment with 100+ microservices, logs are constantly generated across many pods, containers, nodes, namespaces, and environments. Without a centralized pipeline, troubleshooting becomes slow and inconsistent.
Common problems include:
- Application logs are scattered across pods and nodes.
- Developers need manual access to containers or clusters to inspect logs.
- Important errors are discovered too late.
- Log formats are inconsistent across services.
- Sensitive data may appear in logs if there is no processing layer.
- Storage costs grow quickly when hot and cold data are not separated.
- There is no reliable way to replay, reprocess, or recover logs during downstream outages.
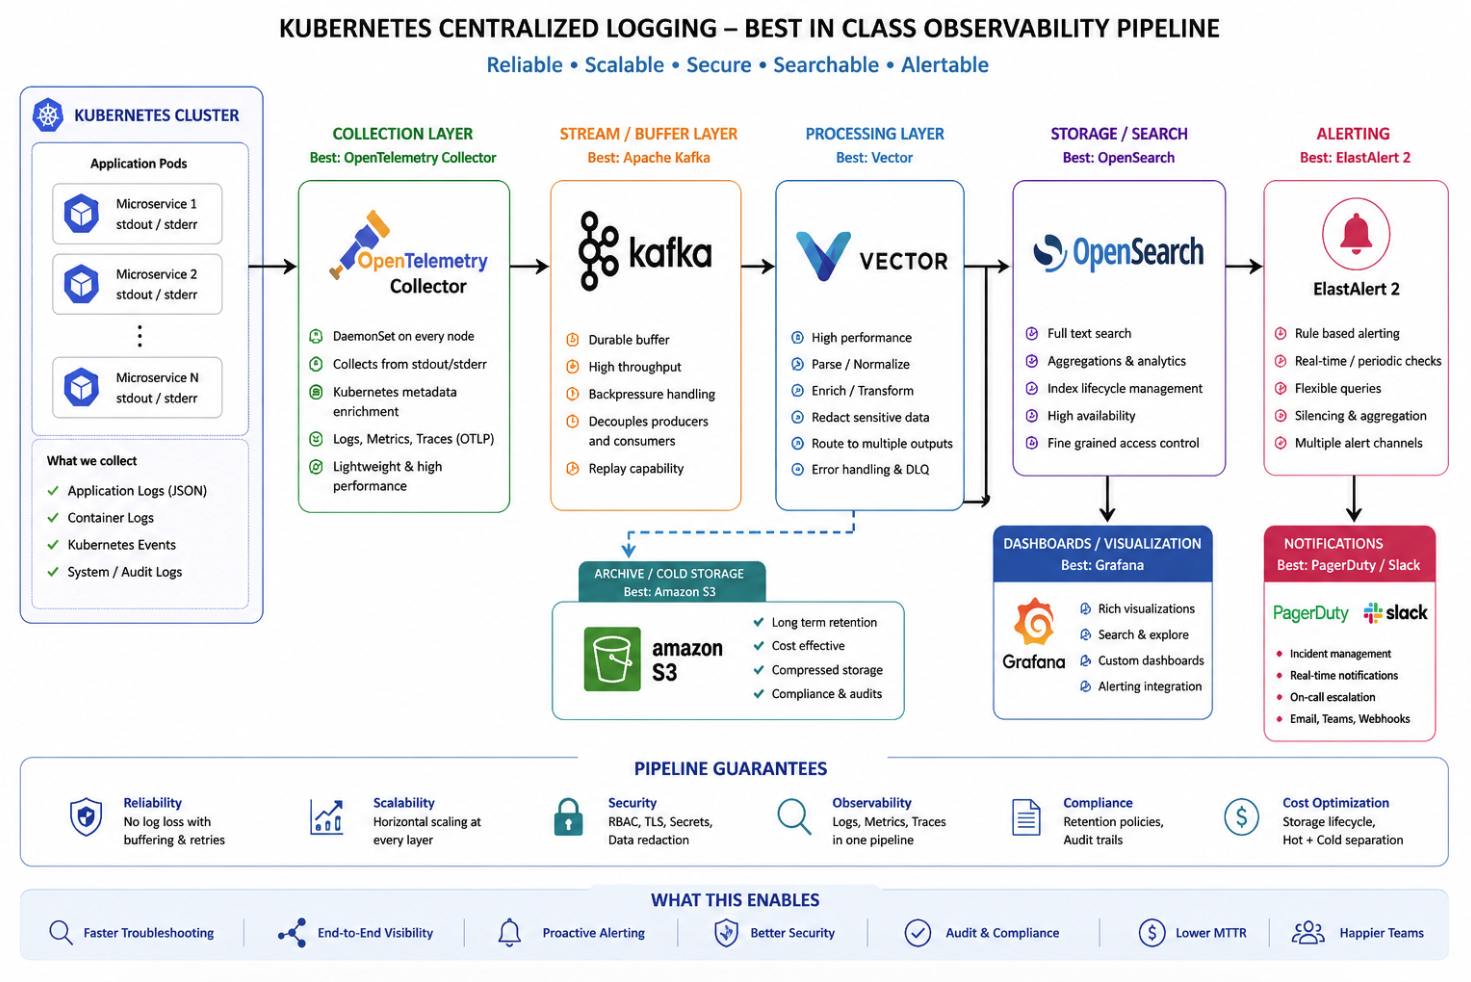
High-Level Architecture
Kubernetes Pods
  → OpenTelemetry Collector
  → Apache Kafka
  → Vector
  → OpenSearch / Elasticsearch
  → Grafana
  → ElastAlert 2
  → PagerDuty / Slack / Email / Teams / Webhooks
For long-term retention:
Vector → Amazon S31. Kubernetes Logging Model
Each microservice writes logs to standard output and standard error. This is preferred for containerized workloads because the application does not need to know anything about the logging backend.
- Application logs
- Container logs
- Kubernetes events
- System and audit logs
2. Collection Layer: OpenTelemetry Collector
The preferred collector is OpenTelemetry Collector, deployed as a DaemonSet across Kubernetes nodes. It collects from stdout/stderr, adds metadata, and forwards data downstream.
3. Stream and Buffer Layer: Apache Kafka
Kafka is the durable buffer between collection and processing, enabling high throughput, backpressure handling, replay capability, and resilience during downstream outages.
4. Processing Layer: Vector
Vector handles parsing, normalization, enrichment, transformation, routing, sensitive data redaction, error handling, and dead-letter queue workflows.
5. Storage and Search: OpenSearch
OpenSearch is the hot storage and search layer for fast investigation, analytics, and lifecycle management.
6. Dashboards and Visualization: Grafana
Grafana dashboards make logs actionable for developers, operations, support, and leadership teams.
7. Alerting: ElastAlert 2
ElastAlert 2 provides rule-based alerting and routes alerts to PagerDuty, Slack, Teams, email, and webhooks.
8. Archive and Cold Storage: Amazon S3
S3 provides long-term, cost-effective retention for compliance, audits, and reprocessing scenarios.
Pipeline Guarantees
- Reliability: buffering, retries, and replay reduce log loss risk.
- Scalability: each layer scales independently.
- Security: RBAC, TLS, secrets management, redaction.
- Observability: logs, metrics, and traces under one strategy.
- Compliance: retention + audit support.
- Cost Optimization: hot/cold separation.
Lessons Learned
- Use structured logs whenever possible.
- Include service name, environment, correlation ID, request ID, and severity.
- Use durable buffering (Kafka) before search storage.
- Normalize formats and redact sensitive data early.
- Separate hot search from cold archive.
- Design alerting to avoid noise.
- Monitor the logging pipeline itself.
Final Result
This pipeline has been running in production for six months across more than 100 microservices. The architecture is reliable, scalable, secure, searchable, alertable, and cost-conscious.